
Performance Test With JMeter Distributed Testing (Step-By-Step Guide)
Concepts of Performance Test
Performance testing is a type of software testing that evaluates responsiveness, stability, scalability, reliability, speed, and resource usage of your software and infrastructure. The goal of performance testing is to identify and eliminate performance bottlenecks in the system, ensuring that it meets the required performance criteria.
Performance testing can be performed on a variety of systems, including web applications, databases, and operating systems.
Performance testing is an important part of the software development process. By identifying and eliminating performance bottlenecks early in the development process, developers can avoid costly and time-consuming problems later on.
Here are some of the benefits of performance testing:
- Improves the user experience by ensuring that the system is responsive and stable under load.
- Helps to identify potential failure points in the system.
- Can help to prevent costly and time-consuming problems later on.
- Can help to improve the system’s scalability and reliability.
- Can help to meet performance requirements.
Types Of Performance Test
There are a few different types of performance test, you can check the table as below:
| Type of Performance Testing | Description | Volume | Time |
|---|---|---|---|
| Load Testing | Measures how a system performs under a specific load. This can be done by simulating a certain number of users or transactions. Load testing can help to identify performance bottlenecks and ensure that the system can handle the expected load. | High | Varies |
| Baseline Testing | Used to establish a baseline for performance testing. This is done by running the application under a known load and measuring the results. The baseline can then be used to compare the performance of the application over time. | Low | Varies |
| Smoke Testing | A quick test that is used to verify that the application is working as expected. Smoke tests are typically used to check for basic functionality, such as the ability to log in and access the main features of the application. | Low | Short |
| Stress Testing | Used to test the limits of an application. Stress testing is typically done by simulating a large number of users or transactions. Stress testing can help to identify performance bottlenecks and ensure that the system can handle unexpected loads. | High | Varies |
| Soak Testing | Used to test the performance of an application over a long period of time. Soak testing is typically done by simulating a constant load on the application. Soak testing can help to identify performance degradation over time. | High | Long |
| Endurance Testing | A type of soak testing that is used to test the performance of an application under extreme conditions. Endurance testing is typically done by simulating a very high load on the application for a long period of time. Endurance testing can help to identify performance problems that may not be evident under normal conditions. | Very high | Very long |
| Capacity Testing | Used to determine the maximum load that an application can handle. Capacity testing is typically done by gradually increasing the load on the application until it reaches a point where it can no longer function properly. Capacity testing can help to determine the amount of resources that are needed to support the application. | High | Varies |
| Longevity Testing | Used to test the performance of an application over a long period of time. Longevity testing is typically done by running the application for a set period of time and monitoring its performance. Longevity testing can help to identify performance problems that may develop over time. | High | Long |
| Peak Testing | Used to test the performance of an application under peak load conditions. Peak load conditions are typically the highest load that an application is expected to experience. Peak testing can help to identify performance problems that may occur during peak load conditions. | Very high | Varies |
| Spike Testing | A type of peak testing that is used to test the performance of an application under sudden spikes in load. Spike testing is typically done by simulating a sudden increase in the load on the application. Spike testing can help to identify performance problems that may occur during sudden spikes in load. | Very high | Short |
| Volume Testing | Used to test the performance of an application under a large volume of data. Volume testing is typically done by simulating a large number of transactions or by loading a large amount of data into the application. Volume testing can help to identify performance problems that may occur when the application is processing a large amount of data. | High | Varies |
| Capacity Tests | Used to determine the maximum amount of data that an application can process. Capacity tests are typically done by gradually increasing the amount of data that is processed by the application until it reaches a point where it can no longer function properly. Capacity tests can help to determine the amount of resources that are needed to support the application. | High | Varies |
| Reliability Testing | Used to test the reliability of an application. Reliability testing is typically done by simulating failures in the application and then measuring the time it takes to recover from the failure. Reliability testing can help to identify performance problems that may occur when the application fails. | High | Varies |
| Scalability Testing | Used to test the scalability of an application. Scalability testing is typically done by gradually increasing the load on the application and measuring how it performs. Scalability testing can help to determine how well the application can handle increasing loads. | High | Varies |
Some docs Soak Test is the same with endurance testing, capacity testing, or longevity testing.
Tools for Performance Test
Here is a list of tools you can use to do performance test:
| Tool | Features | Pros | Cons |
|---|---|---|---|
| Apache JMeter | Open source, easy to use, and can be used to test a variety of applications. It is also highly customizable and can be used to test a wide range of performance metrics. | Free, easy to learn, and highly customizable. | Can be complex to set up and use, and does not have as many features as some commercial tools. |
| HP LoadRunner | Commercial tool that is powerful and has a wide range of features. It is also easy to use and can be used to test a wide range of performance metrics. | Powerful, easy to use, and has a wide range of features. | Expensive, and can be difficult to learn. |
| Gatling | Open source tool that is powerful and has a wide range of features. It is also easy to use and can be used to test a wide range of performance metrics. | Free, easy to learn, and highly scalable. | Can be complex to set up and use, and does not have as many open source options as some other tools. |
| Blazemeter | Cloud-based tool that is easy to use and has a wide range of features. It is also affordable and can be used to test a wide range of performance metrics. | Affordable, easy to use, and has a wide range of features. | Does not have as many open source options as some other tools. |
| k6 | Open source tool that is easy to use and can be used to test a variety of applications. It is also highly customizable and can be used to test a wide range of performance metrics. | Free, easy to learn, and highly scalable. | Can be complex to set up and use, and does not have as many open source options as some other tools. |
| NeoLoad | Commercial tool that is powerful and has a wide range of features. It is also easy to use and can be used to test a wide range of performance metrics. | Powerful, easy to use, and has a wide range of features. | Expensive, and can be difficult to learn. |
| TestComplete | Commercial tool that is powerful and has a wide range of features. It is also easy to use and can be used to test a wide range of performance metrics. | Powerful, easy to use, and has a wide range of features. | Expensive, and can be difficult to learn. |
| Silk Performer | Commercial tool that is powerful and has a wide range of features. It is also easy to use and can be used to test a wide range of performance metrics. | Powerful, easy to use, and has a wide range of features. | Expensive, and can be difficult to learn. |
| Rational Performance Tester | Commercial tool that is powerful and has a wide range of features. It is also easy to use and can be used to test a wide range of performance metrics. | Powerful, easy to use, and has a wide range of features. | Expensive, and can be difficult to learn. |
| Apica LoadView | Commercial tool that is powerful and has a wide range of features. It is also easy to use and can be used to test a wide range of performance metrics. | Powerful, easy to use, and has a wide range of features. | Expensive, and can be difficult to learn. |
| AppDynamics | Commercial tool that is powerful and has a wide range of features. It is also easy to use and can be used to test a wide range of performance metrics. | Powerful, easy to use, and has a wide range of features. | Expensive, and can be difficult to learn. |
| Dynatrace | Commercial tool that is powerful and has a wide range of features. It is also easy to use and can be used to test a wide range of performance metrics. | Powerful, easy to use, and has a wide range of features. | Expensive, and can be difficult to learn. |
| New Relic | Commercial tool that is powerful and has a wide range of features. It is also easy to use and can be used to test a wide range of performance metrics. | Powerful, easy to use, and has a wide range of features. | Expensive, and can be difficult to learn. |
The best tool for you will depend on your specific needs and budget. If you are looking for an open source tool that is easy to use, Apache JMeter is a good option. If you are looking for a commercial tool that is powerful and has a wide range of features, LoadRunner or NeoLoad are good options.
It is important to note that no single tool is perfect for all performance testing needs. It is often helpful to use a combination of tools to get the best results.
JMeter Distributed Testing
Now let me introduce how to do a Soak Test with JMeter distributed testing.
We need one controller node with multiple worker nodes to do the testing, if you need more workload, just increase the number of worker nodes. All the workers will connect to the target system to perform the pre-defined tests.
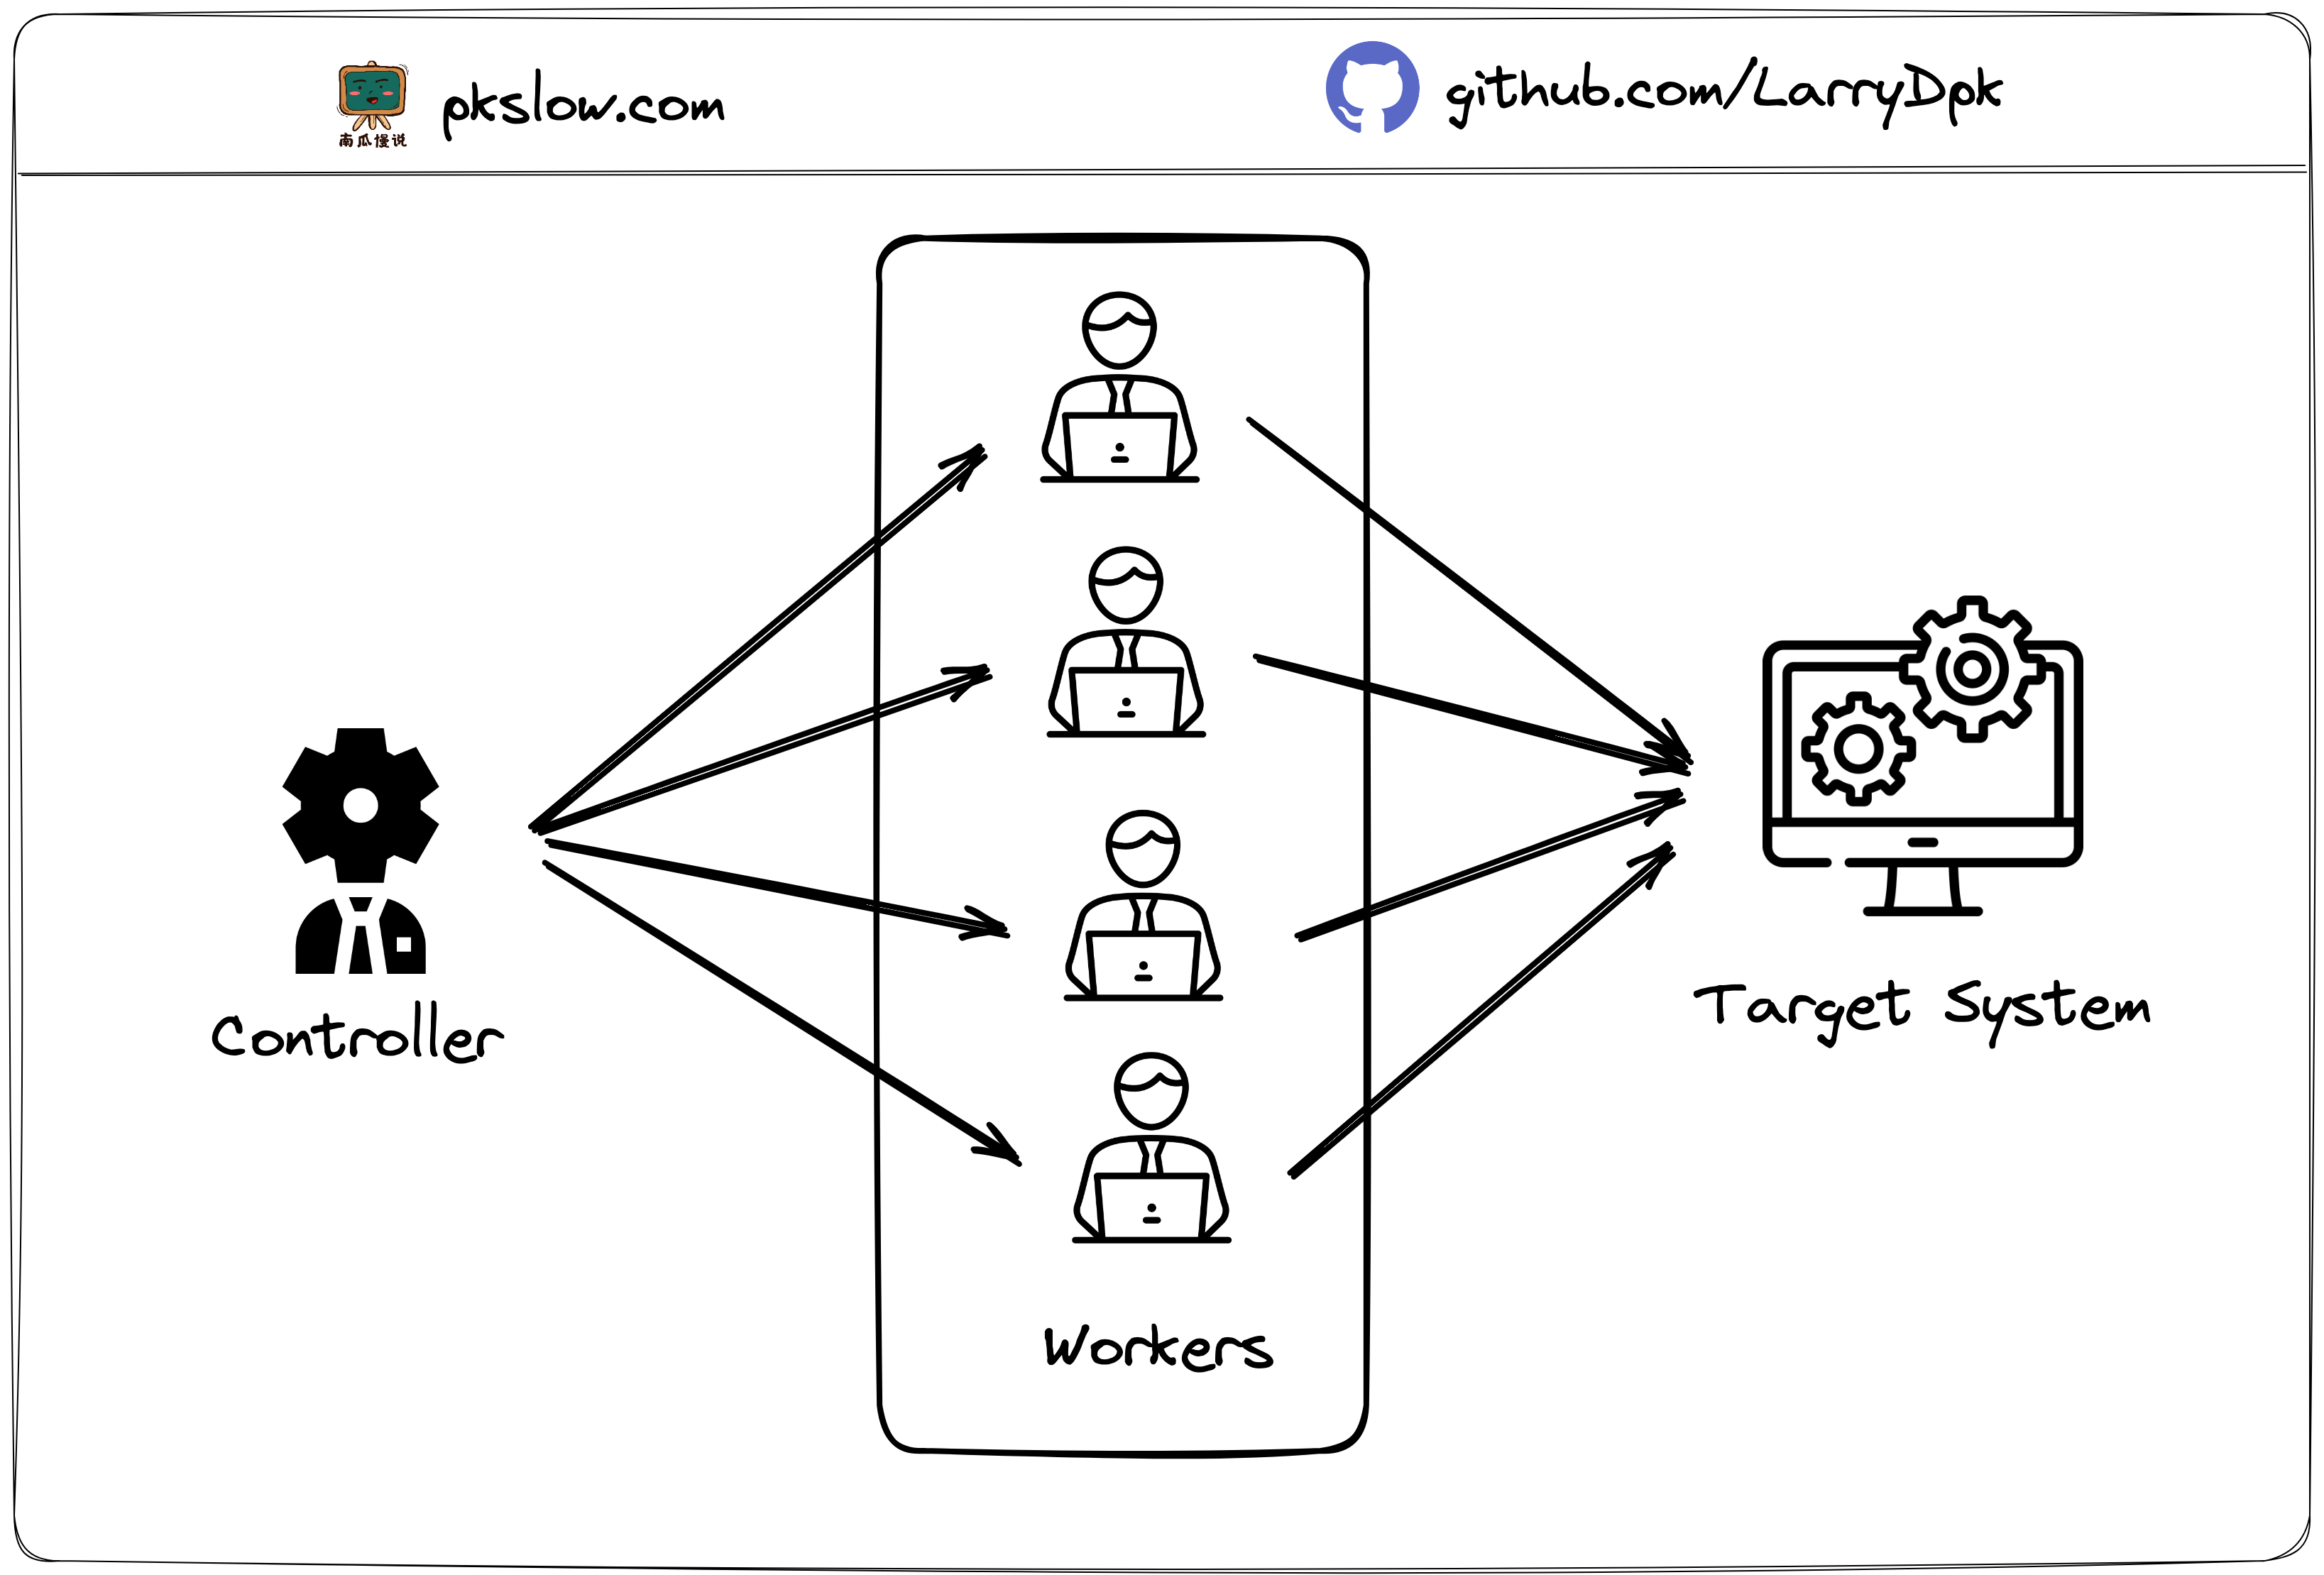
The workers can run in different servers, that’s why it can create plenty of requests at the same time.
Test Step by Step
I will show how to do the test step by step. This is the overview of the servers.
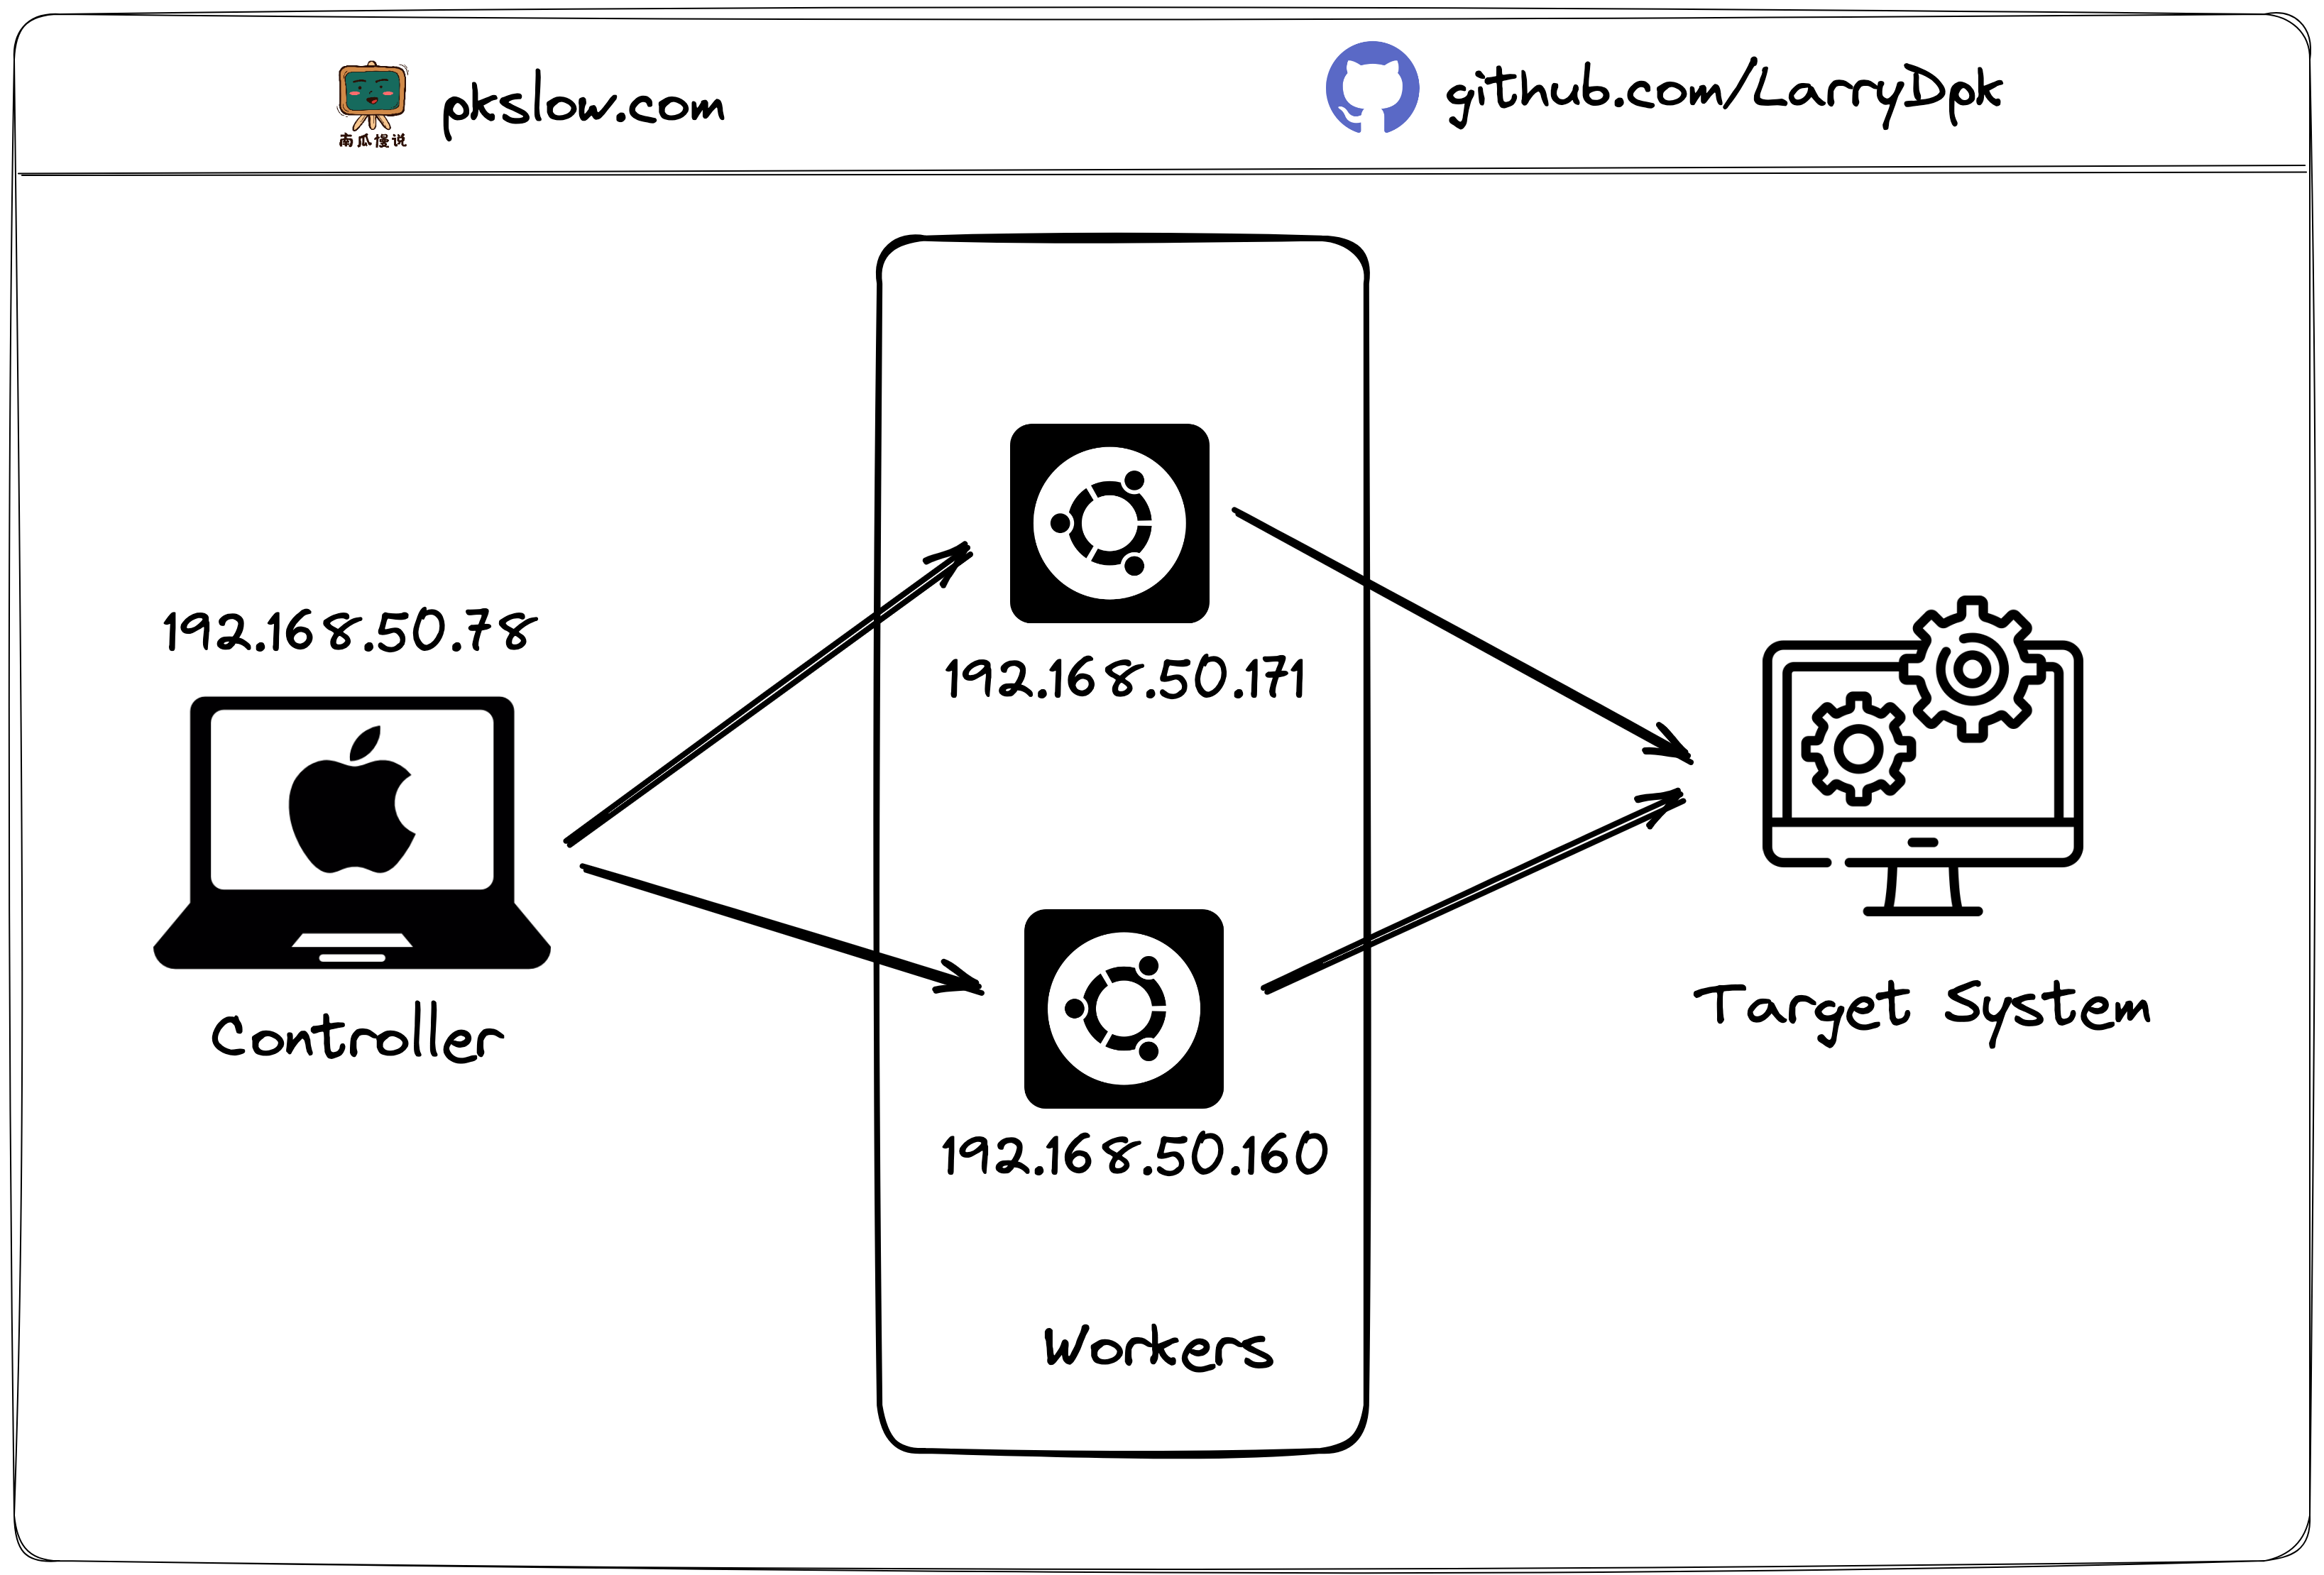
I run the controller on my Macbook, and created two workers on Ubuntu servers. The target system is Bing, stackoverflow, QQ.
Step 1: Install JDK for controller and workers
The Apache JMeter is a Java based application, it needs a Java runtime to start up. Install JDK on Ubuntu:
sudo apt install openjdk-11-jdk
Stpe 2: Download Apache JMeter
Go the the download page and download the apache-jmeter-5.5.zip, and unzip the package:
unzip apache-jmeter-5.5.zip
We need to download for both controller and workers.
For controller, I place JMeter here:
/Users/larry/Software/apache-jmeter-5.5
For workers, I place JMeter here:
home/larry/software/apache-jmeter-5.5
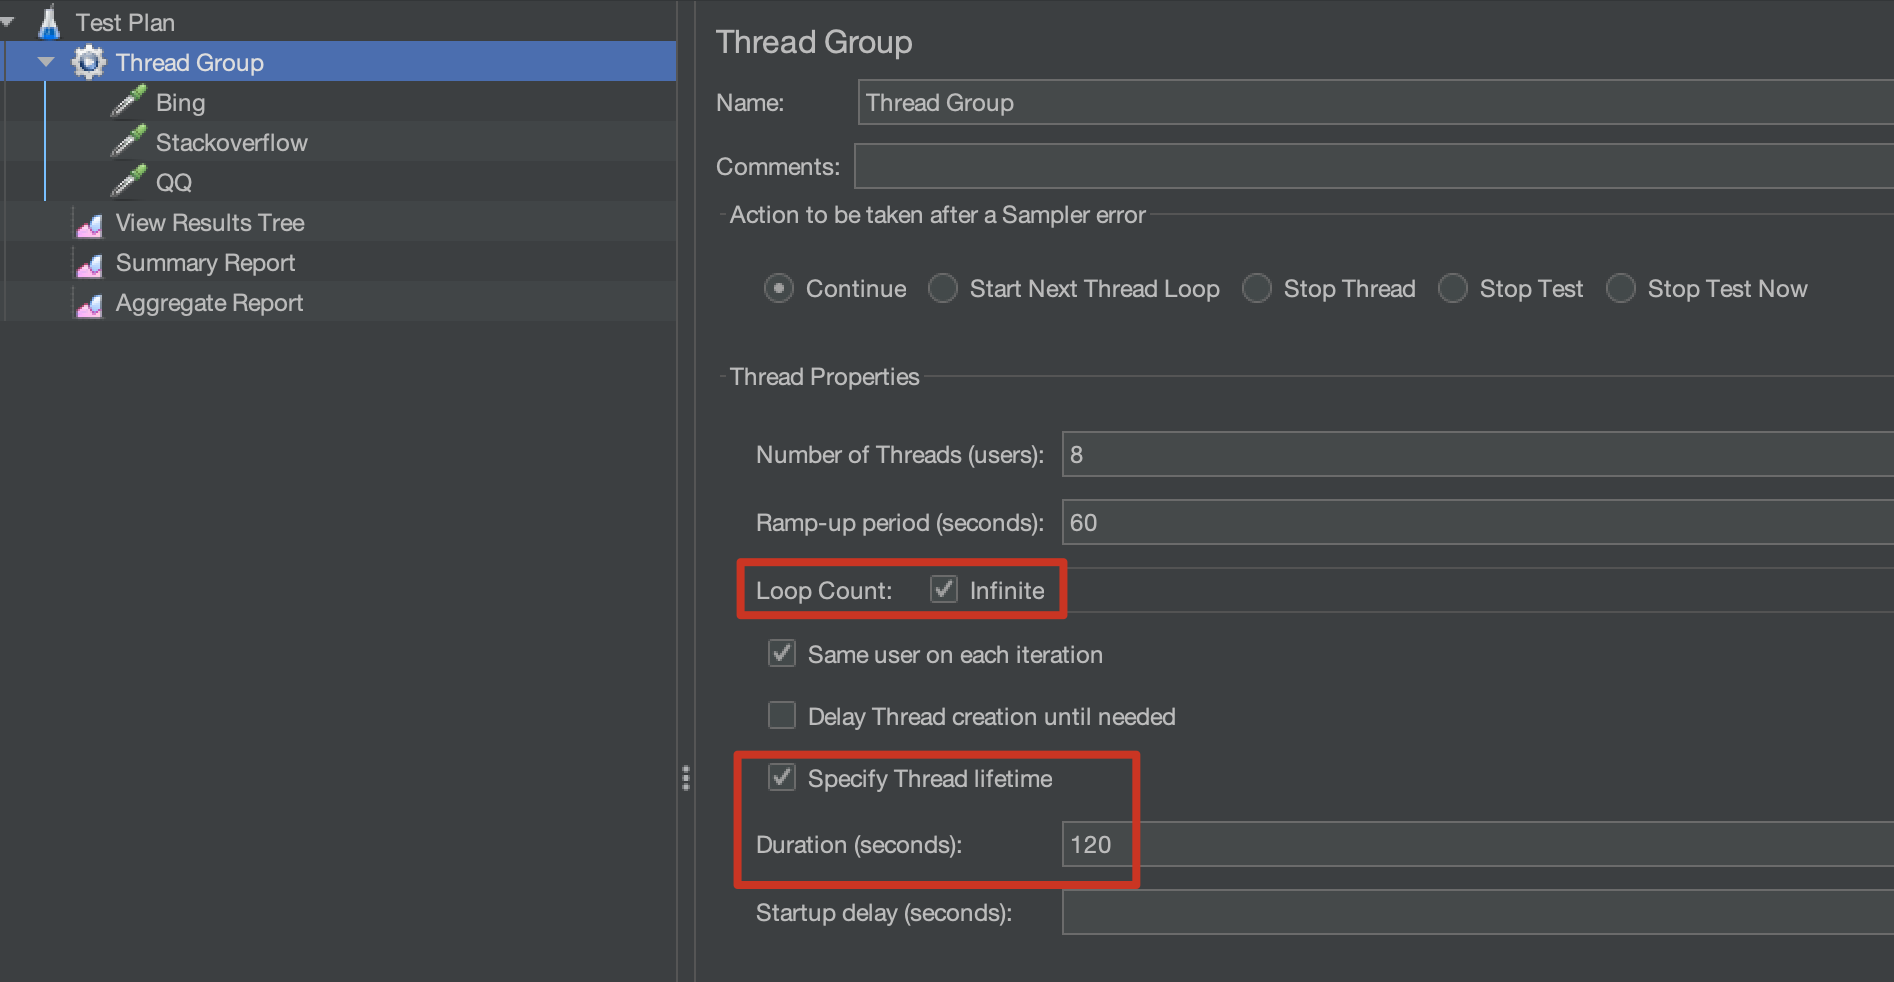
Step 3: Prepare the JMX file
JMeter stores the defined test cases in .jmx file. Open the JMeter UI and write the cases:

I run the test with 8 threads, 60s ramp-up and infinite loop for 120s.
I saved the file here:
$ ls /Users/larry/Software/apache-jmeter-5.5/projects/pkslow
performance-test.jmx
Just controller need the jmx file, worker will receive the info from controller.
Step 4: Start up the workers
Start up the two workers with this command:
- Worker 1:
$ /home/larry/software/apache-jmeter-5.5/bin/jmeter-server -Dserver.rmi.ssl.disable=true -Djava.rmi.server.hostname=192.168.50.171
Created remote object: UnicastServerRef2 [liveRef: [endpoint:[192.168.50.171:41709](local),objID:[-2af2edf6:1882245cfde:-7fff, 1980465993472976097]]]
- Worker 2:
$ /home/larry/software/apache-jmeter-5.5/bin/jmeter-server -Dserver.rmi.ssl.disable=true -Djava.rmi.server.hostname=192.168.50.60
Created remote object: UnicastServerRef2 [liveRef: [endpoint:[192.168.50.60:45337](local),objID:[18489452:1882246a88b:-7fff, 4749047852254882466]]]
Note: You may hit java.rmi.RemoteException without specify the
java.rmi.server.hostname.
$ ./software/apache-jmeter-5.5/bin/jmeter-server -Dserver.rmi.ssl.disable=true
May 15, 2023 5:43:16 PM java.util.prefs.FileSystemPreferences$1 run
INFO: Created user preferences directory.
Created remote object: UnicastServerRef2 [liveRef: [endpoint:[127.0.1.1:33021](local),objID:[-7155c199:1881ecaf233:-7fff, -6972385484103483700]]]
Server failed to start: java.rmi.RemoteException: Cannot start. ubuntu is a loopback address.
An error occurred: Cannot start. ubuntu is a loopback address.
Step 5: Start the controller to run the test
$ cd /Users/larry/Software/apache-jmeter-5.5/

$ ./bin/jmeter -n -t projects/pkslow/performance-test.jmx -l projects/pkslow/performance-test.csv -e -o projects/pkslow/Reports -Dserver.rmi.ssl.disable=true -R 192.168.50.171,192.168.50.60
Creating summariser <summary>
Created the tree successfully using projects/pkslow/performance-test.jmx
Configuring remote engine: 192.168.50.171
Configuring remote engine: 192.168.50.60
Starting distributed test with remote engines: [192.168.50.171, 192.168.50.60] @ May 16, 2023 10:37:31 PM CST (1684247851079)
Remote engines have been started:[192.168.50.171, 192.168.50.60]
Waiting for possible Shutdown/StopTestNow/HeapDump/ThreadDump message on port 4445
summary +      1 in 00:00:02 =    0.7/s Avg:  1260 Min:  1260 Max:  1260 Err:     0 (0.00%) Active: 2 Started: 2 Finished: 0
summary +    111 in 00:02:31 =    0.7/s Avg:  4433 Min:    41 Max: 50474 Err:     4 (3.60%) Active: 15 Started: 16 Finished: 1
summary =    112 in 00:02:33 =    0.7/s Avg:  4405 Min:    41 Max: 50474 Err:     4 (3.57%)
summary +     64 in 00:00:19 =    3.3/s Avg: 25706 Min:    62 Max: 66745 Err:    31 (48.44%) Active: 0 Started: 16 Finished: 16
summary =    176 in 00:02:52 =    1.0/s Avg: 12151 Min:    41 Max: 66745 Err:    35 (19.89%)
Tidying up remote @ May 16, 2023 10:40:24 PM CST (1684248024629)
... end of run
You can check more log in jmeter.log:
$ tail -f jmeter.log
2023-05-16 22:40:29,956 INFO o.a.j.r.d.JsonExporter: Found data for consumer statisticsSummary in context
2023-05-16 22:40:29,957 INFO o.a.j.r.d.JsonExporter: Creating statistics for overall
2023-05-16 22:40:29,957 INFO o.a.j.r.d.JsonExporter: Creating statistics for other transactions
2023-05-16 22:40:29,957 INFO o.a.j.r.d.JsonExporter: Checking output folder
2023-05-16 22:40:29,958 INFO o.a.j.r.d.JsonExporter: Writing statistics JSON to /Users/larry/Software/apache-jmeter-5.5/projects/pkslow/Reports/statistics.json
2023-05-16 22:40:30,006 INFO o.a.j.r.d.ReportGenerator: Exporting data using exporter:'html' of className:'org.apache.jmeter.report.dashboard.HtmlTemplateExporter'
2023-05-16 22:40:30,007 INFO o.a.j.r.d.HtmlTemplateExporter: Will generate dashboard in folder: /Users/larry/Software/apache-jmeter-5.5/projects/pkslow/Reports
2023-05-16 22:40:30,142 INFO o.a.j.r.d.HtmlTemplateExporter: Report will be generated in: /Users/larry/Software/apache-jmeter-5.5/projects/pkslow/Reports, creating folder structure
2023-05-16 22:40:30,145 INFO o.a.j.r.d.TemplateVisitor: Copying folder from '/Users/larry/Software/apache-jmeter-5.5/bin/report-template' to '/Users/larry/Software/apache-jmeter-5.5/projects/pkslow/Reports', got message: /Users/larry/Software/apache-jmeter-5.5/projects/pkslow/Reports, found non empty folder with following content [/Users/larry/Software/apache-jmeter-5.5/projects/pkslow/Reports/statistics.json], will be ignored
2023-05-16 22:40:30,472 INFO o.a.j.JMeter: Dashboard generated
The workers will print some simple log:
$ /home/larry/software/apache-jmeter-5.5/bin/jmeter-server -Dserver.rmi.ssl.disable=true -Djava.rmi.server.hostname=192.168.50.171
Created remote object: UnicastServerRef2 [liveRef: [endpoint:[192.168.50.171:44621](local),objID:[4d13369d:18824fd059a:-7fff, 2287886479123818682]]]
Starting the test on host 192.168.50.171 @ 2023 May 16 22:37:31 HKT (1684247851980)
Warning: Nashorn engine is planned to be removed from a future JDK release
Finished the test on host 192.168.50.171 @ 2023 May 16 22:40:24 HKT (1684248024679)
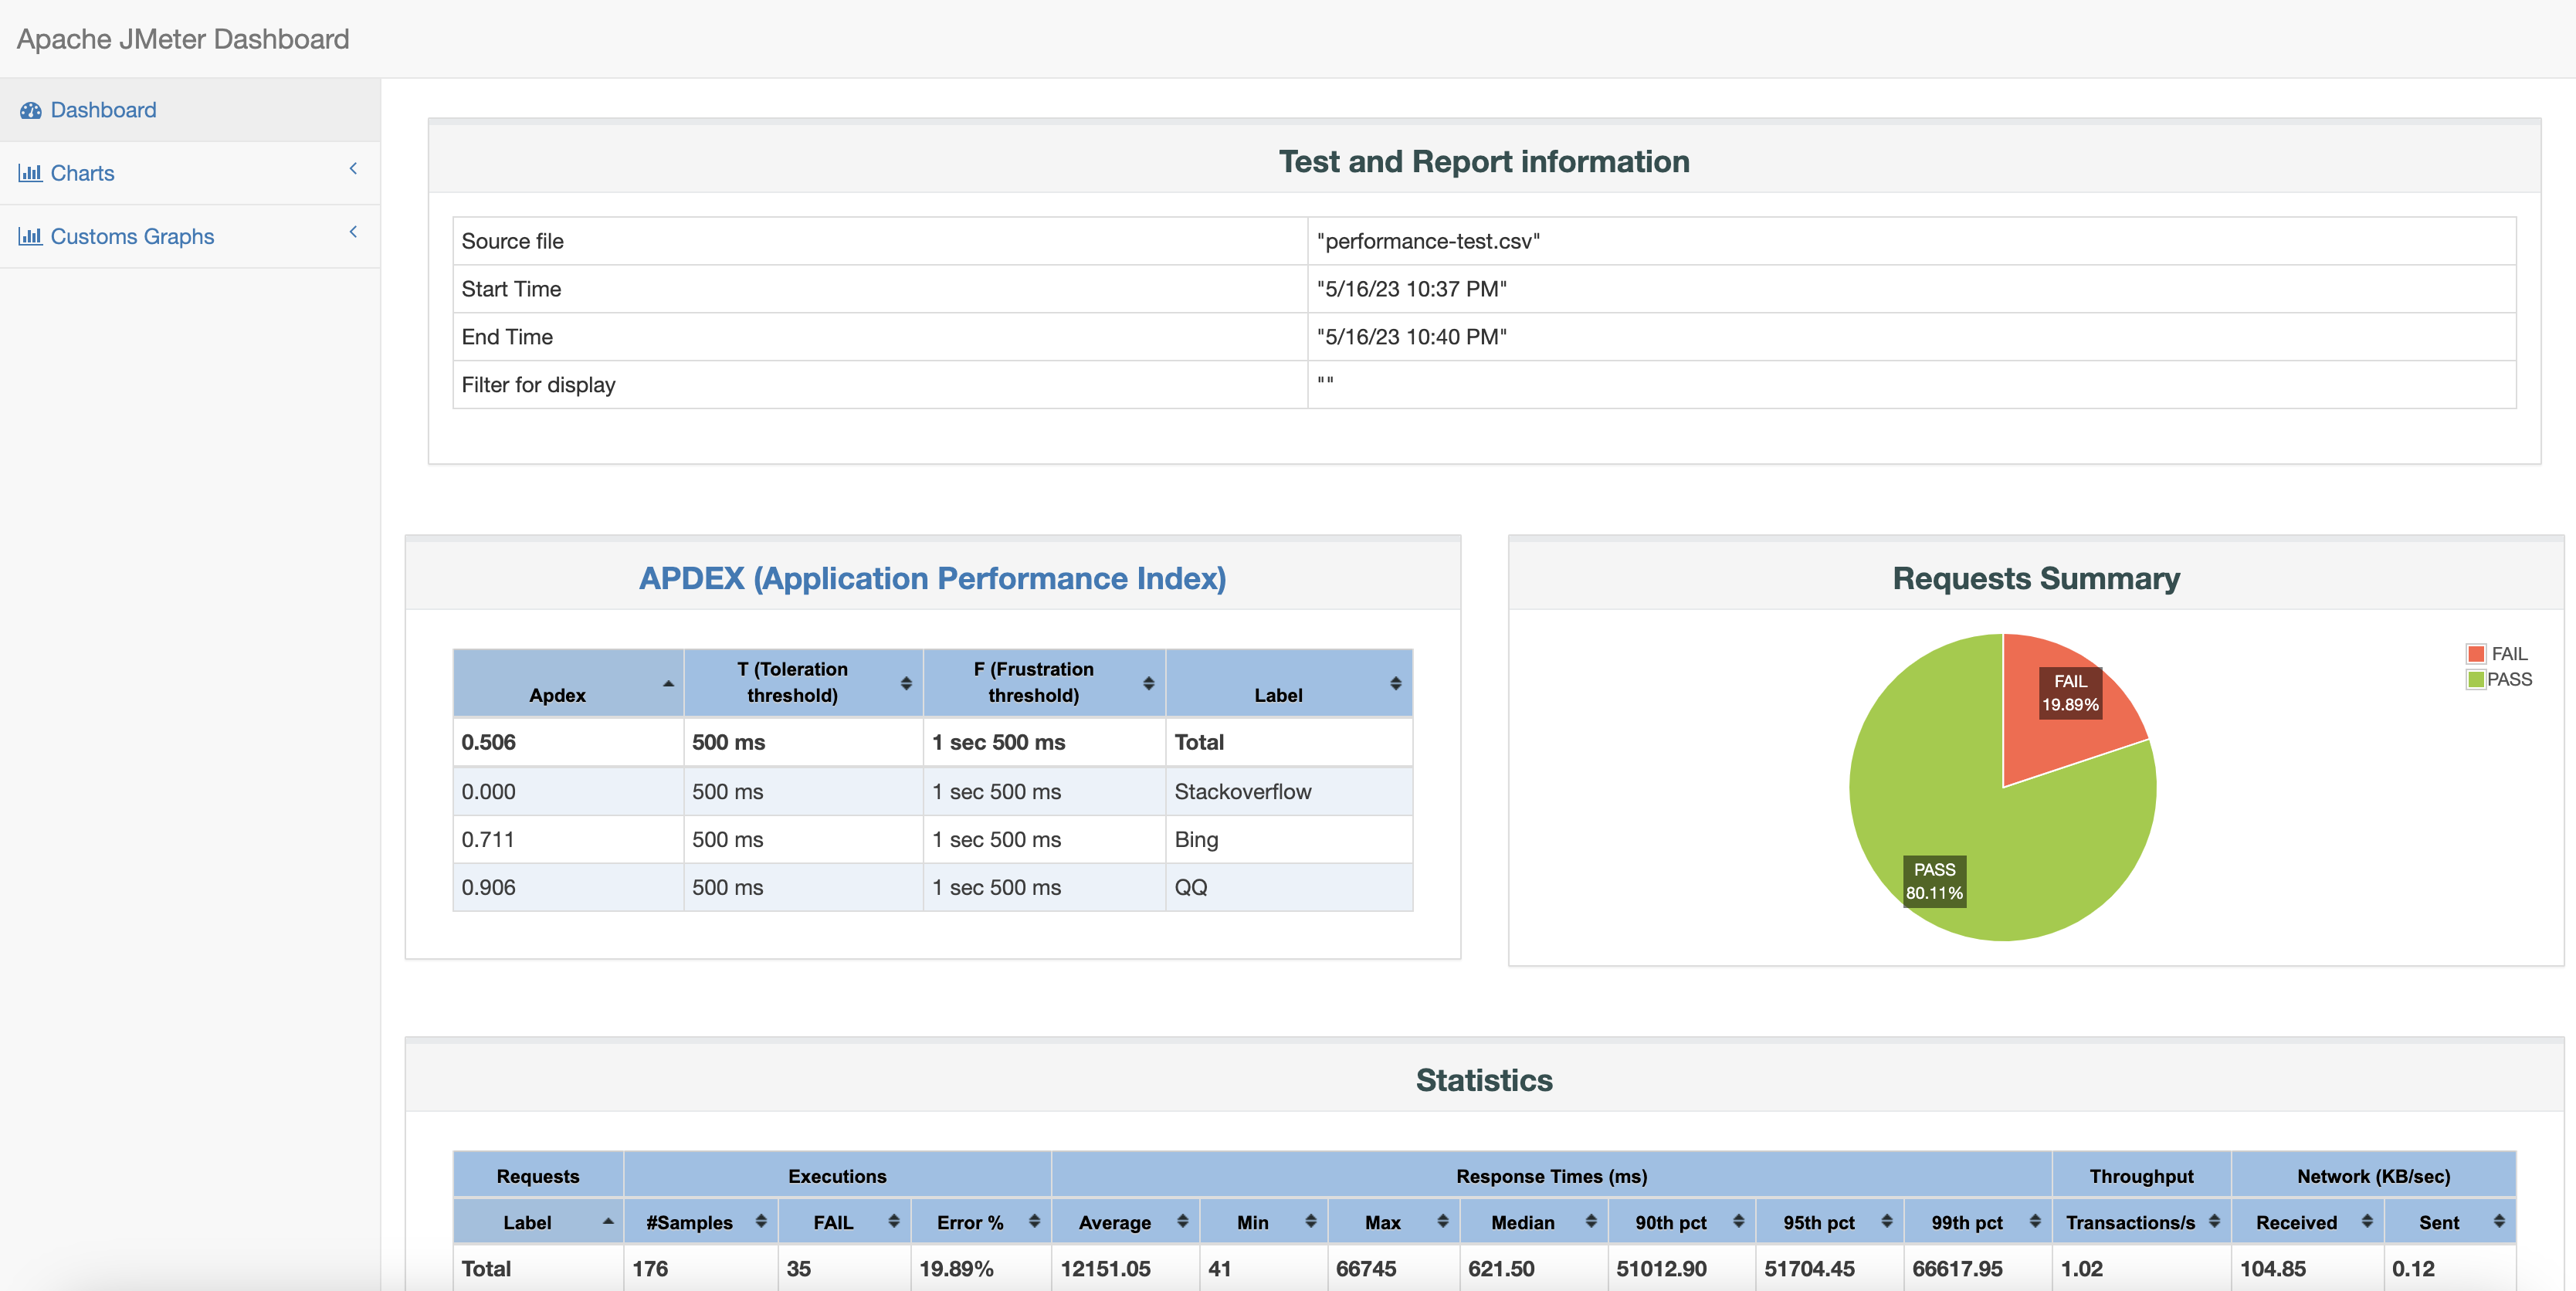
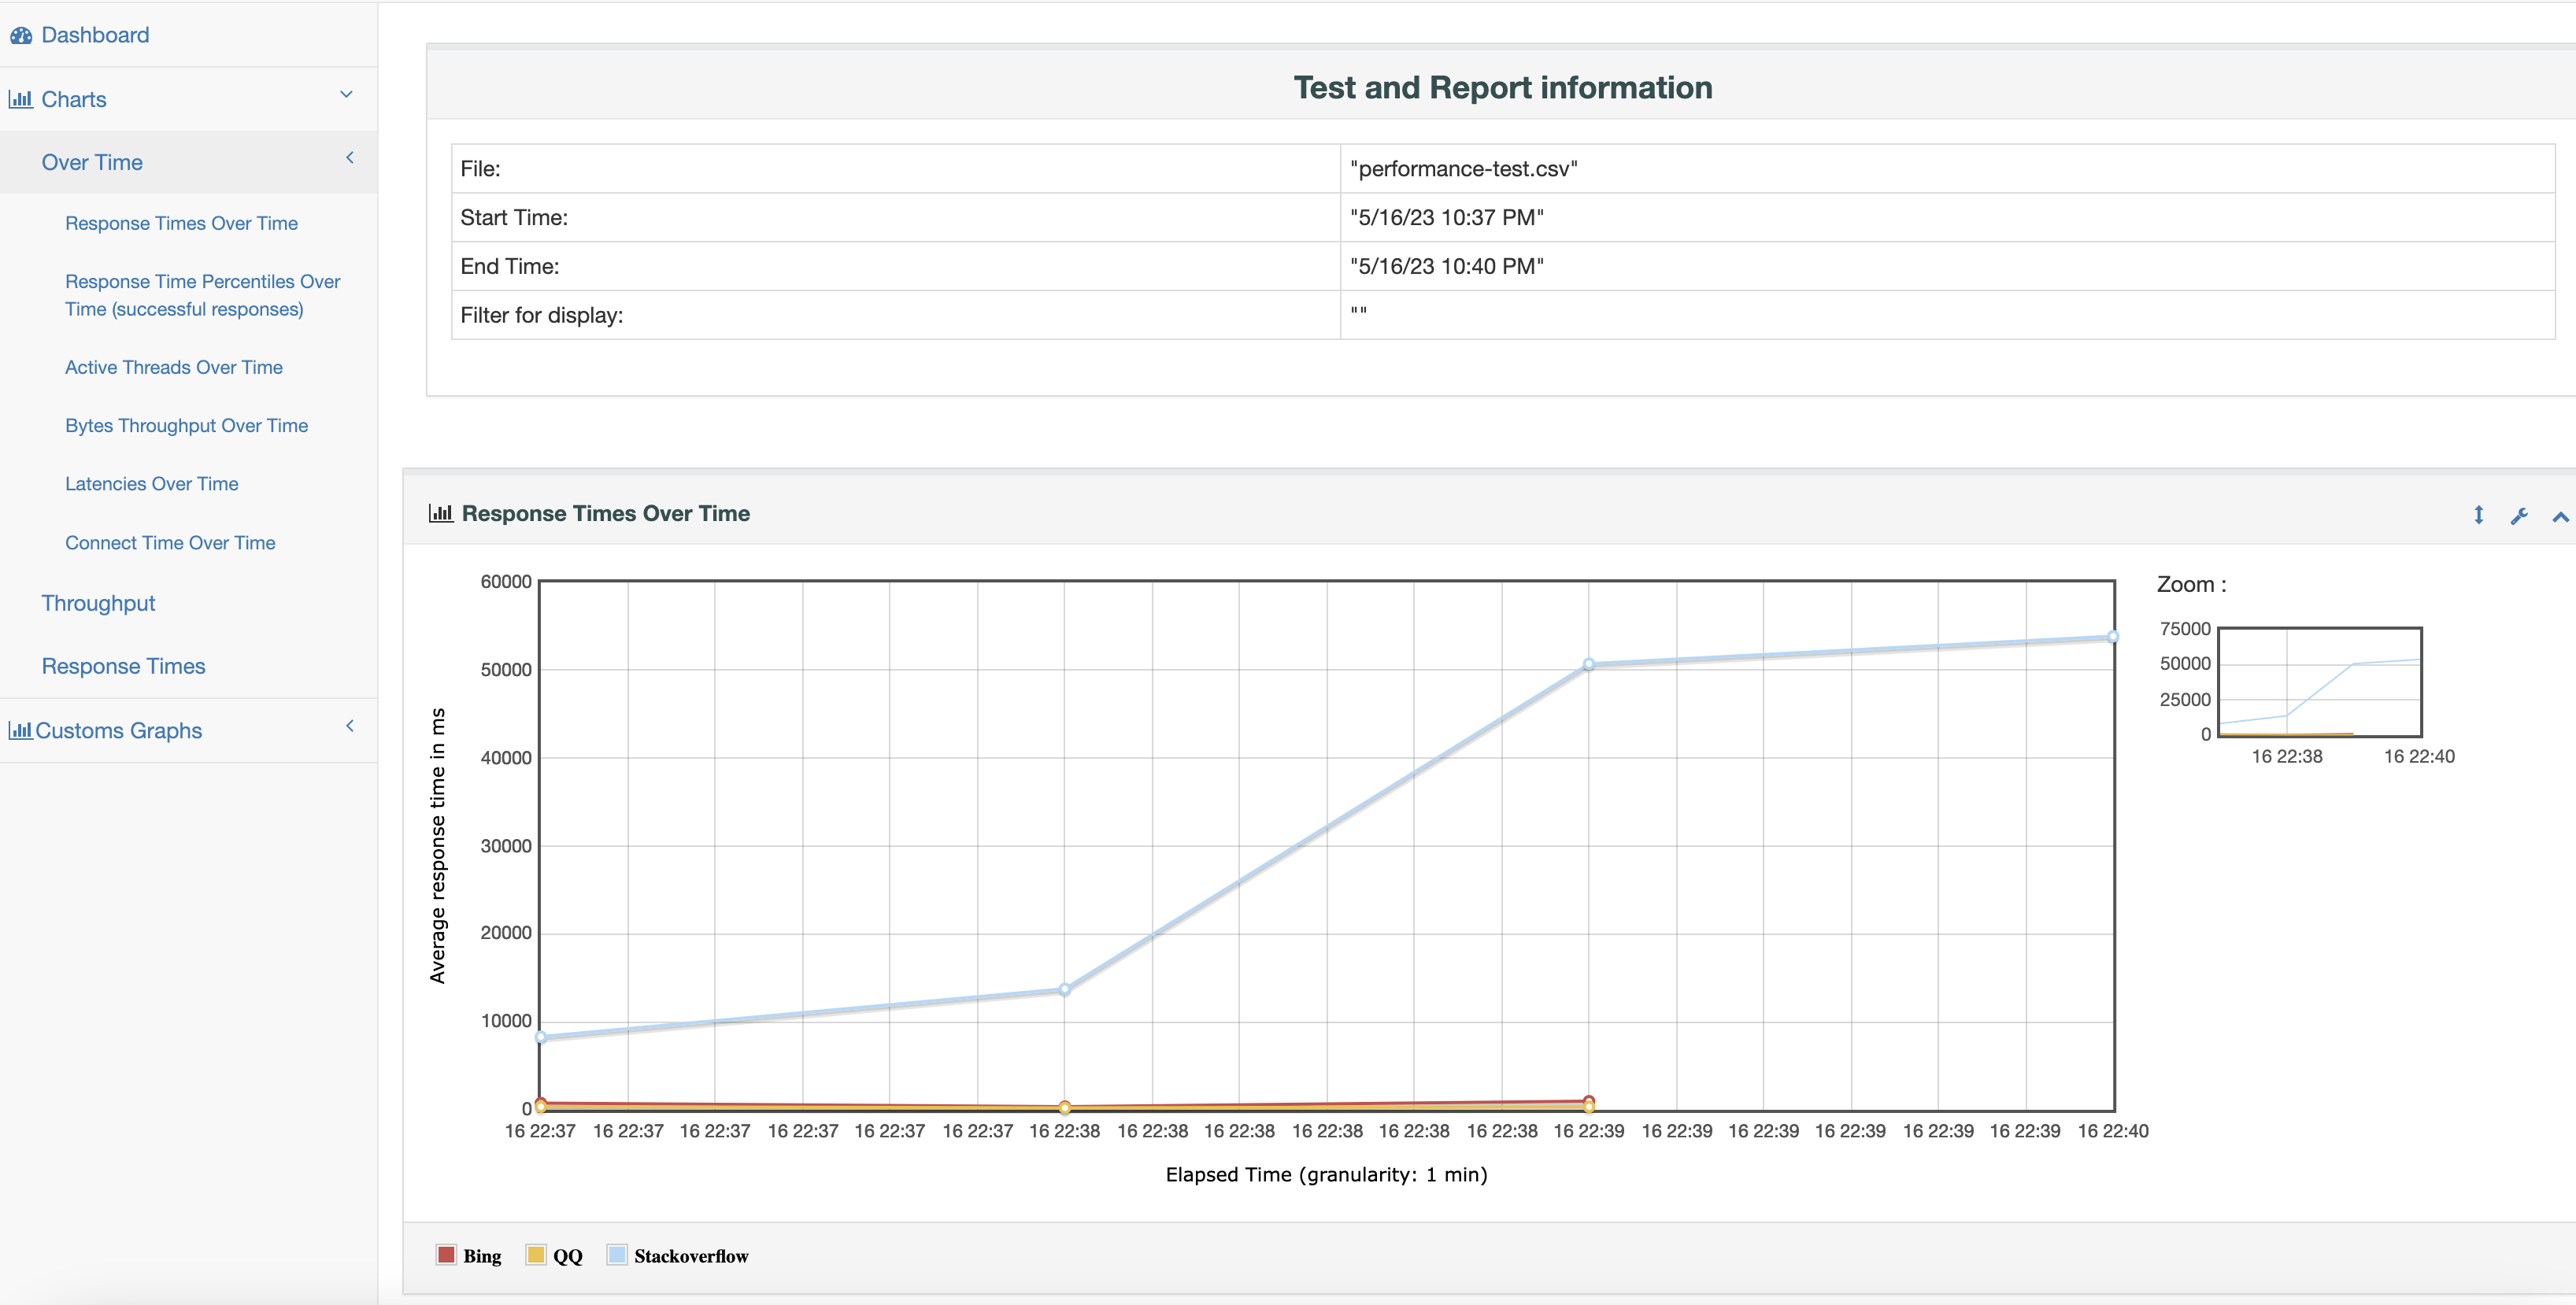
Step 6: result and report
After the whole test completed, you can find the result and report:
$ ls -l /Users/larry/Software/apache-jmeter-5.5/projects/pkslow/
total 72
drwxr-xr-x  6 larry  staff    192 May 16 22:40 Reports
-rw-r--r--  1 larry  staff  23472 May 16 22:40 performance-test.csv
-rw-r--r--  1 larry  staff  10593 May 16 09:50 performance-test.jmx
We can open the index.html in the Reports folder:
Other tips
Change the worker server port
For workers, the default server port is 1099, you can change the port in properties file or command line parameter:
$ /home/larry/software/apache-jmeter-5.5/bin/jmeter-server -Dserver.rmi.ssl.disable=true -Djava.rmi.server.hostname=192.168.50.60 -Dserver_port=1984
So the controller need to change the port:
$ ./bin/jmeter -n -t projects/pkslow/performance-test.jmx -l projects/pkslow/performance-test.csv -e -o projects/pkslow/Reports -Dserver.rmi.ssl.disable=true -R 192.168.50.171:1984,192.168.50.60:1984
What’s more, with different port, you can start up more workers in one server.
run command with nohup
As the test may take a long time to complete, it’s better run all the command with nohup:
$ nohup ./bin/jmeter -n -t projects/pkslow/performance-test.jmx -l projects/pkslow/performance-test.csv -e -o projects/pkslow/Reports -Dserver.rmi.ssl.disable=true -R 192.168.50.171:1984,192.168.50.60:1984 &
[1] 81248
Save the result and resport with datetime
$ nohup ./bin/jmeter -n -t projects/pkslow/performance-test.jmx -l projects/pkslow/performance-test."$(date +%F.%T)".csv -e -o projects/pkslow/Reports-"$(date +%F.%T)" -Dserver.rmi.ssl.disable=true -R 192.168.50.171:1984,192.168.50.60:1984 &
Summary
Performance test is quite important and Apache JMeter can help us. Hope this article help you to understand and set up the remote test.
Please find the jmx code in: LarryDpk/pkslow-samples
References:
awesome-jmeter
JMeter distributed testing
How to install ssh on Ubuntu Linux using apt-get
API Performance Testing for Success