# 用Python做了一个广东疫情新增病例动态视频
# 1 简介
最近广东疫情实在是太严重了,特别是广州。作为南大门,人口流动太大,又毗邻港澳,防疫任务太重。从11月以来,就发展极其迅猛。疫情也给大家的生活带来了诸多不便,我有许多同事和朋友都居家隔离了。
时代的尘埃落在个体身上,都是灾难。
为了对疫情了解更多,我用Python写了个小程序,来生成一个新增病例的变化视频,且记录一下这个无聊的过程吧。
# 2 数据准备
为了获得准确的第一手数据,我是关注了健康广东这个公众号,每天早上可以看到最新的数据。同时在广东省卫健委的网站 (opens new window)也可以获取。
接着会把数据记录在Excel表格里,方面查看。11月以来数据如下:
注:新增 = 新增确诊 + 新增无症状
| 日期 | 广东确诊 | 广州确诊 | 广东无症状 | 广州无症状 | 广东新增 | 广州新增 |
|---|---|---|---|---|---|---|
| 11月1日 | 239 | 190 | 458 | 289 | 697 | 479 |
| 11月2日 | 106 | 73 | 298 | 253 | 404 | 326 |
| 11月3日 | 69 | 50 | 356 | 323 | 425 | 373 |
| 11月4日 | 187 | 142 | 470 | 430 | 657 | 572 |
| 11月5日 | 160 | 111 | 669 | 635 | 829 | 746 |
| 11月6日 | 133 | 66 | 1330 | 1259 | 1463 | 1325 |
| 11月7日 | 185 | 122 | 1882 | 1813 | 2067 | 1935 |
| 11月8日 | 198 | 114 | 2330 | 2263 | 2528 | 2377 |
| 11月9日 | 197 | 91 | 2611 | 2546 | 2808 | 2637 |
| 11月10日 | 200 | 125 | 2507 | 2430 | 2707 | 2555 |
| 11月11日 | 289 | 225 | 2461 | 2358 | 2750 | 2583 |
| 11月12日 | 323 | 259 | 2996 | 2921 | 3319 | 3180 |
| 11月13日 | 247 | 189 | 3541 | 3464 | 3788 | 3653 |
| 11月14日 | 219 | 189 | 3941 | 3876 | 4160 | 4065 |
| 11月15日 | 173 | 147 | 5047 | 4977 | 5220 | 5124 |
| 11月16日 | 195 | 158 | 6215 | 6138 | 6410 | 6296 |
| 11月17日 | 307 | 275 | 8576 | 8486 | 8883 | 8761 |
| 11月18日 | 321 | 255 | 9110 | 8989 | 9431 | 9244 |
| 11月19日 | 355 | 269 | 8535 | 8444 | 8890 | 8713 |
| 11月20日 | 281 | 200 | 8381 | 8234 | 8662 | 8434 |
| 11月21日 | 384 | 296 | 8101 | 7885 | 8485 | 8181 |
| 11月22日 | 347 | 253 | 8241 | 7957 | 8588 | 8210 |
| 11月23日 | 353 | 235 | 7951 | 7735 | 8304 | 7970 |
| 11月24日 | 549 | 428 | 7505 | 7192 | 8054 | 7620 |
| 11月25日 | 395 | 257 | 7584 | 7267 | 7979 | 7524 |
# 3 读取数据
因为要用Python展示,即做数据可视化(数据可视化的工具很多,不一定要用Python),所以需要用Python读取Excel中的数据。我使用的是库pyexcel。代码如下:
def load_data():
    records = p.get_records(file_name="covid-19.xlsx")
    print(records)
    data_x = []
    data_y1 = []
    data_y2 = []
    for record in records[1:]:
        dt = excel_to_datatime(record['-1'])
        data_x.append(dt)
        data_y1.append(record['-6'])
        data_y2.append(record['-7'])
    return data_x, data_y1, data_y2
其中covid-19.xlsx就是Excel文件名。而-1, -6, -7分别是对应的日期,和最后两列,Debug的时候定位的,暂时没空深究。
# 3.1 Excel日期的问题
Excel日期是用一个数字来表示的,所以需要把这个数值转化成Python的日期类型,具体代码如下:
def excel_to_datatime(excel_date):
    dt = datetime.fromordinal(datetime(1900, 1, 1).toordinal() + excel_date - 2)
    return dt
同时为了格式化输出日期,新增了个函数,没啥特别的:
def datetime_to_str(dt, pattern):
    return pattern.format(dt.month, dt.day)
# 4 Python数据可视化
Python做数据可视化的库可太多了,我选择的是matplotlib,一方面是因为它用的多,资料也多;另一方面是我大学用过Matlab,两者很像,省去一些学习时间成本。
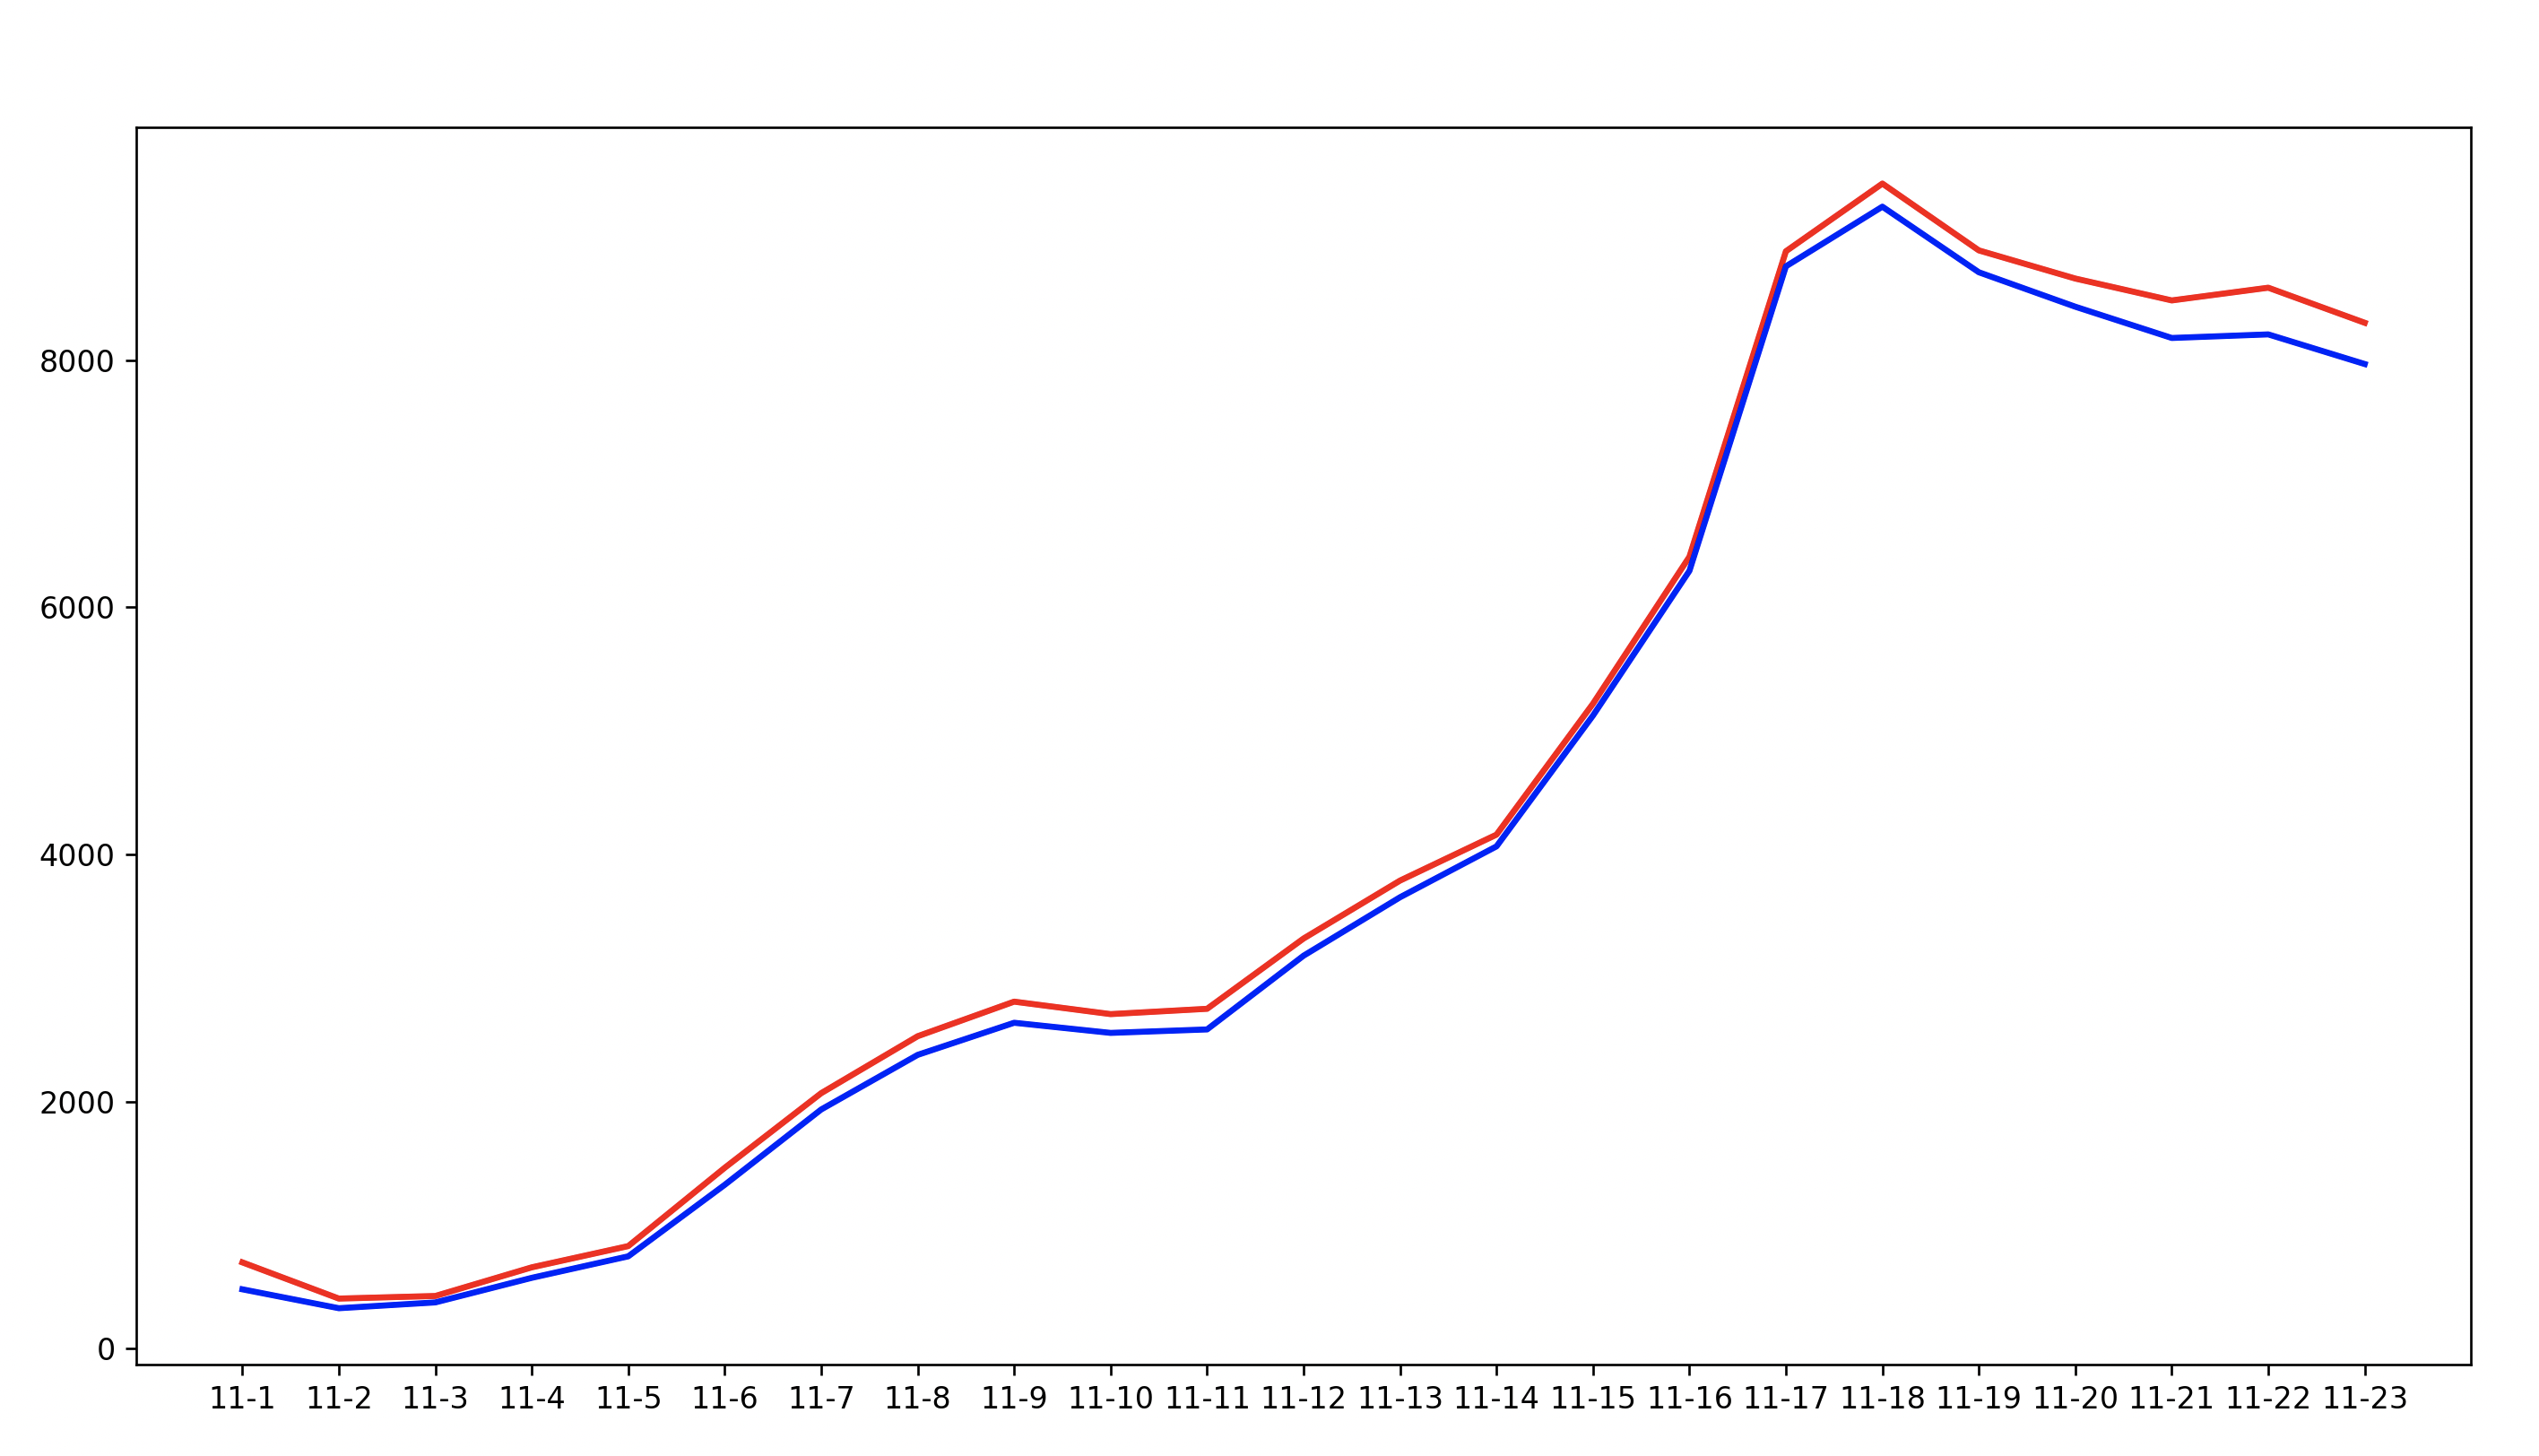
为了简便,打算就画个曲线变化图就行了,所以横轴为日期,纵轴为新增数。画个简单的图代码如下:
# plot
fig, ax = plt.subplots(figsize=(4, 3), dpi=120)
ax.plot(data_x, data_y1, linewidth=2.0, color='red')
ax.plot(data_x, data_y2, linewidth=2.0, color='blue')
plt.show()
红色是广东新增,蓝色是广州新增:
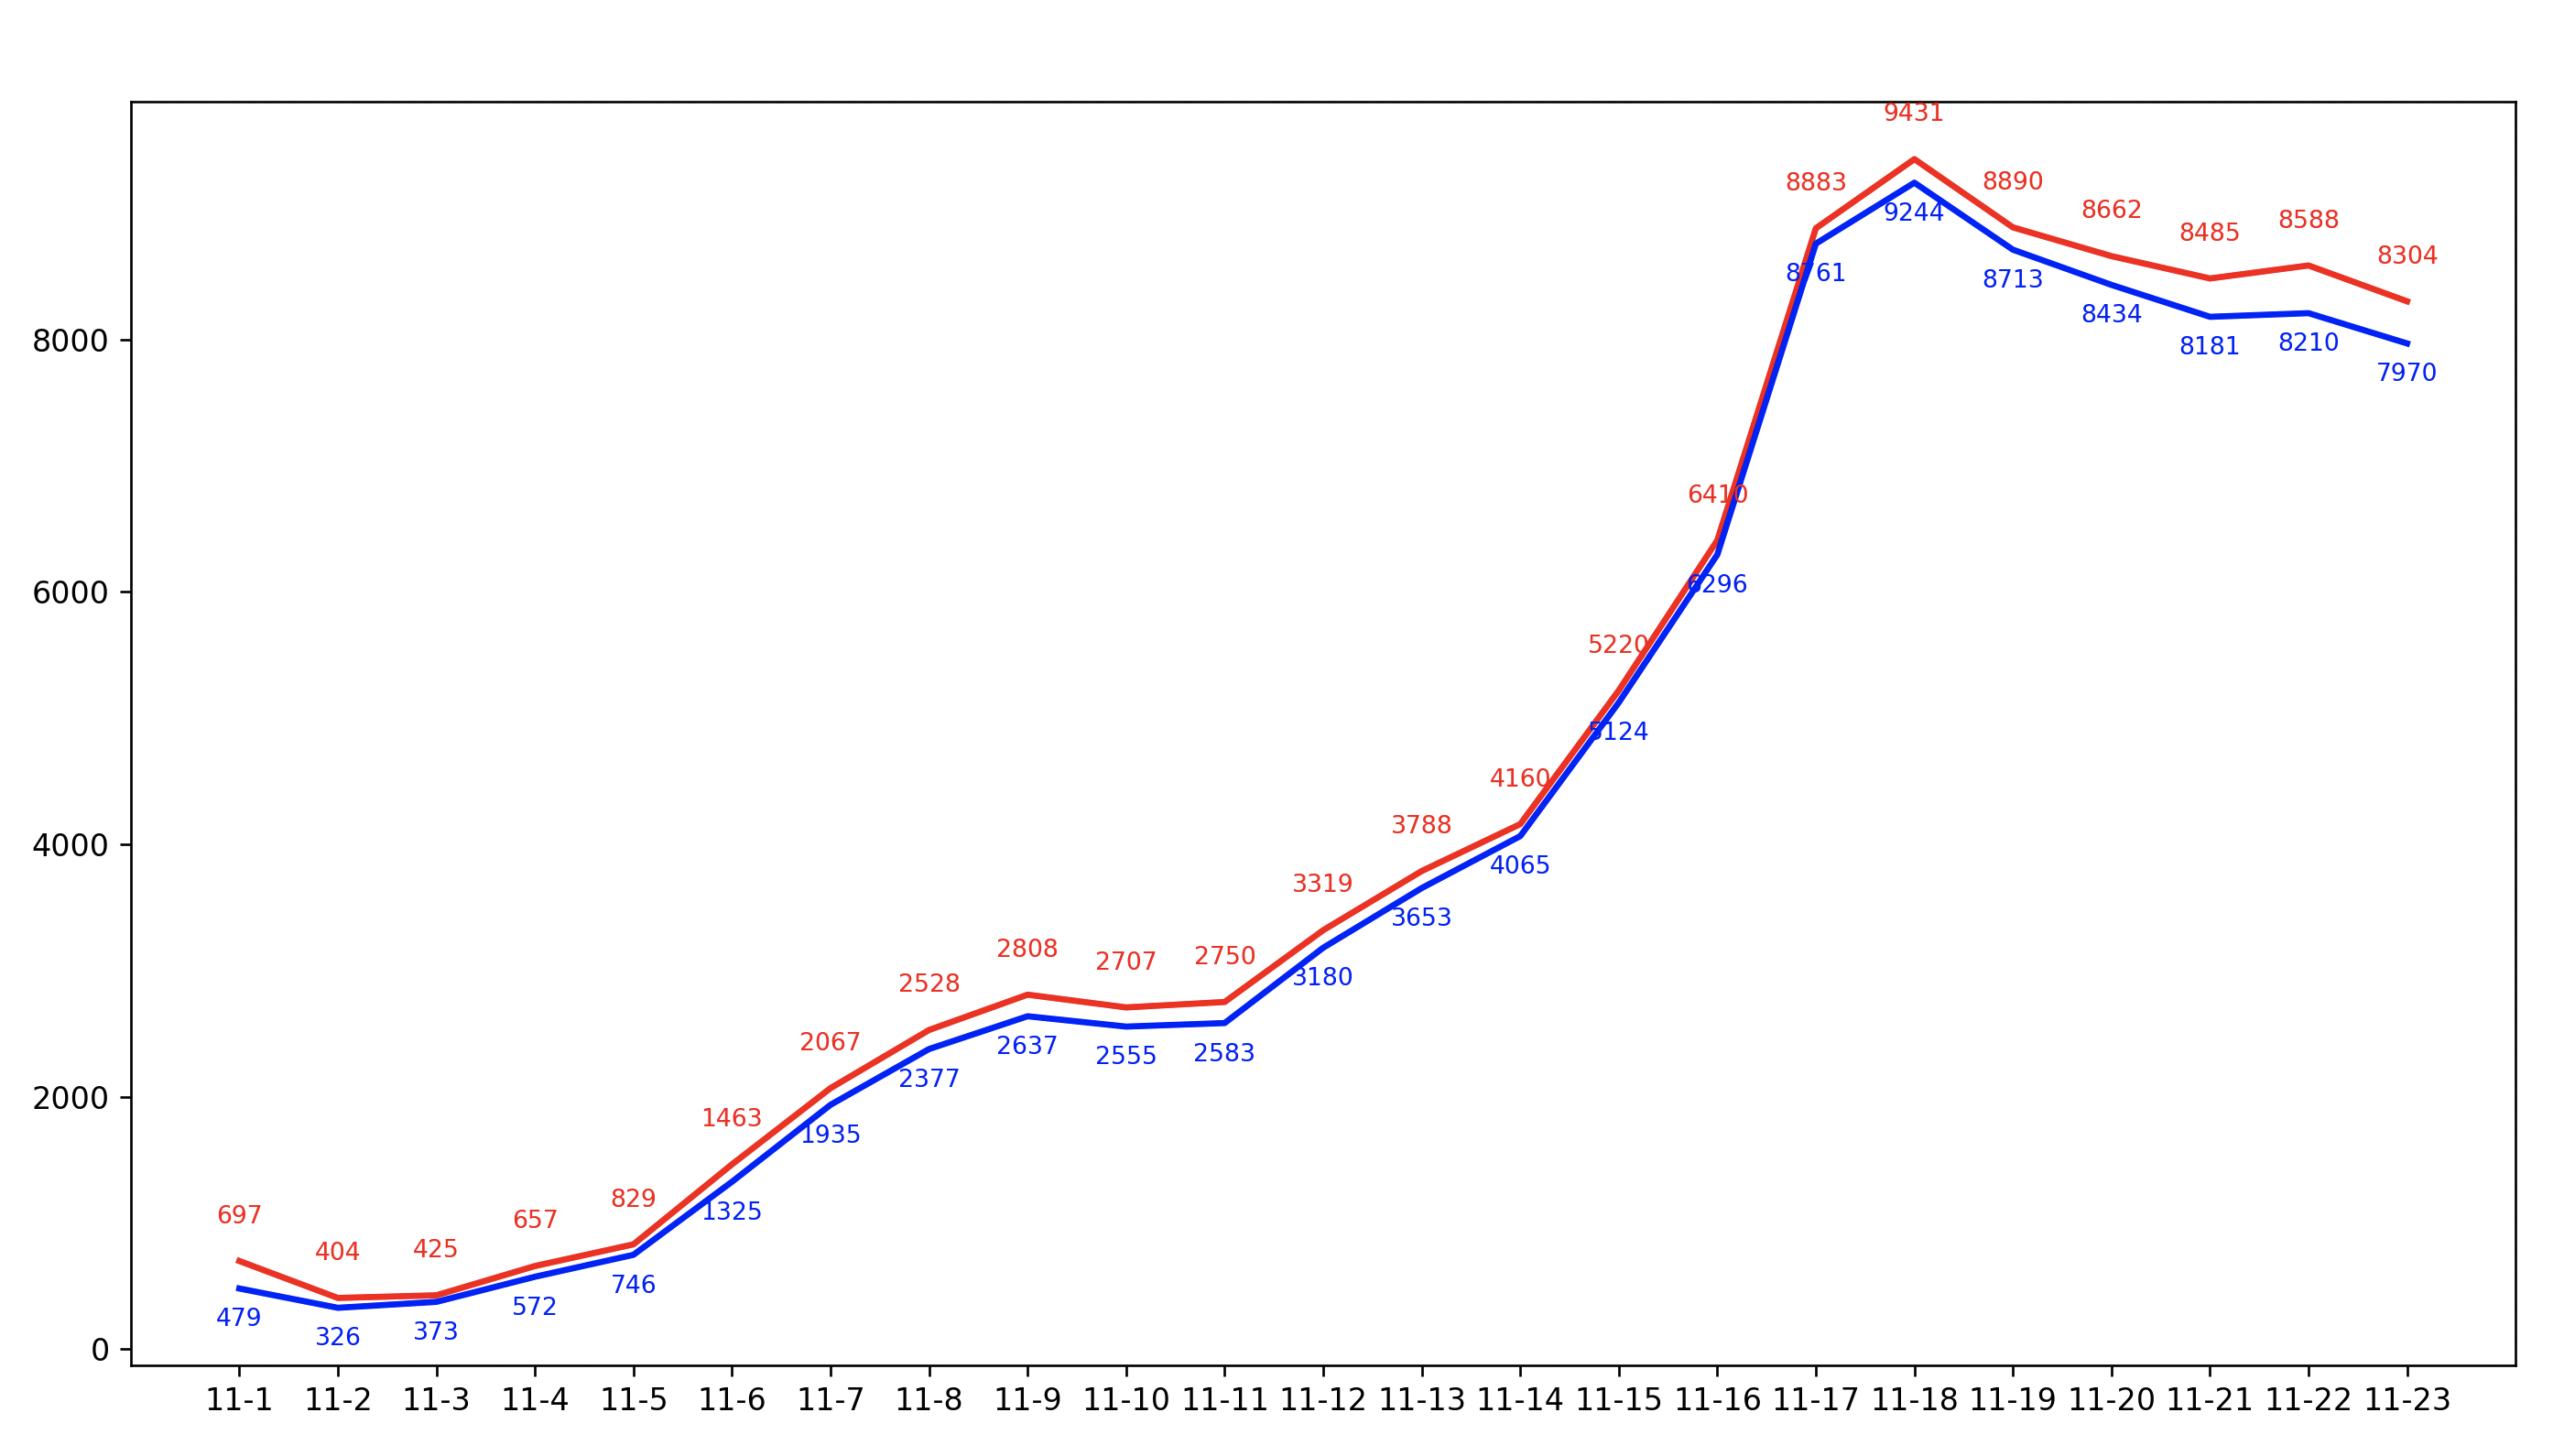
把数据标在曲线上:
for i, v in enumerate(data_y1):
    ax.text(data_x[i], v + 300, v, ha='center', color='red', fontsize=8)

for i, v in enumerate(data_y2):
    ax.text(data_x[i], v - 300, v, ha='center', color='blue', fontsize=8)
可以看到,3000到6000,再到8000的变化是极快的:
后面还有许多细节优化,就不一一讲解了。
# 5 转化视频
首先要明白,视频的本质还是图片,只是把图片放快了而已。所以,可以画图,就有办法做视频。好在matplotlib也提供了制作动画的函数,直接调用即可。需要调用的是animation.FuncAnimation这个方法。我们要提供初始化函数,还有如何制作每一帧画面的函数,就可以制作视频了。
初始化就直接给个空就行:
def init():
    line1.set_data([], [])
    line2.set_data([], [])
    return line1, line2, text1, text2, text_gd, text_gz, text_date
每一帧的函数如下:
def animate(i):
print('Processing {} for {}'.format(i, data_x[i]))
x = range(i + 2)
x = x[1:]
line1.set_data(x, data_y1[:i + 1])
line2.set_data(x, data_y2[:i + 1])
text1 = ax.text(i + 1, data_y1[i] + 150, data_y1[i], ha='center', color='red', fontsize=8)
text2 = ax.text(i + 1, data_y2[i] - 150, data_y2[i], ha='center', color='blue', fontsize=8)
text_gd.set_text('广东新增:' + str(data_y1[i]))
text_gz.set_text('广州新增:' + str(data_y2[i]))
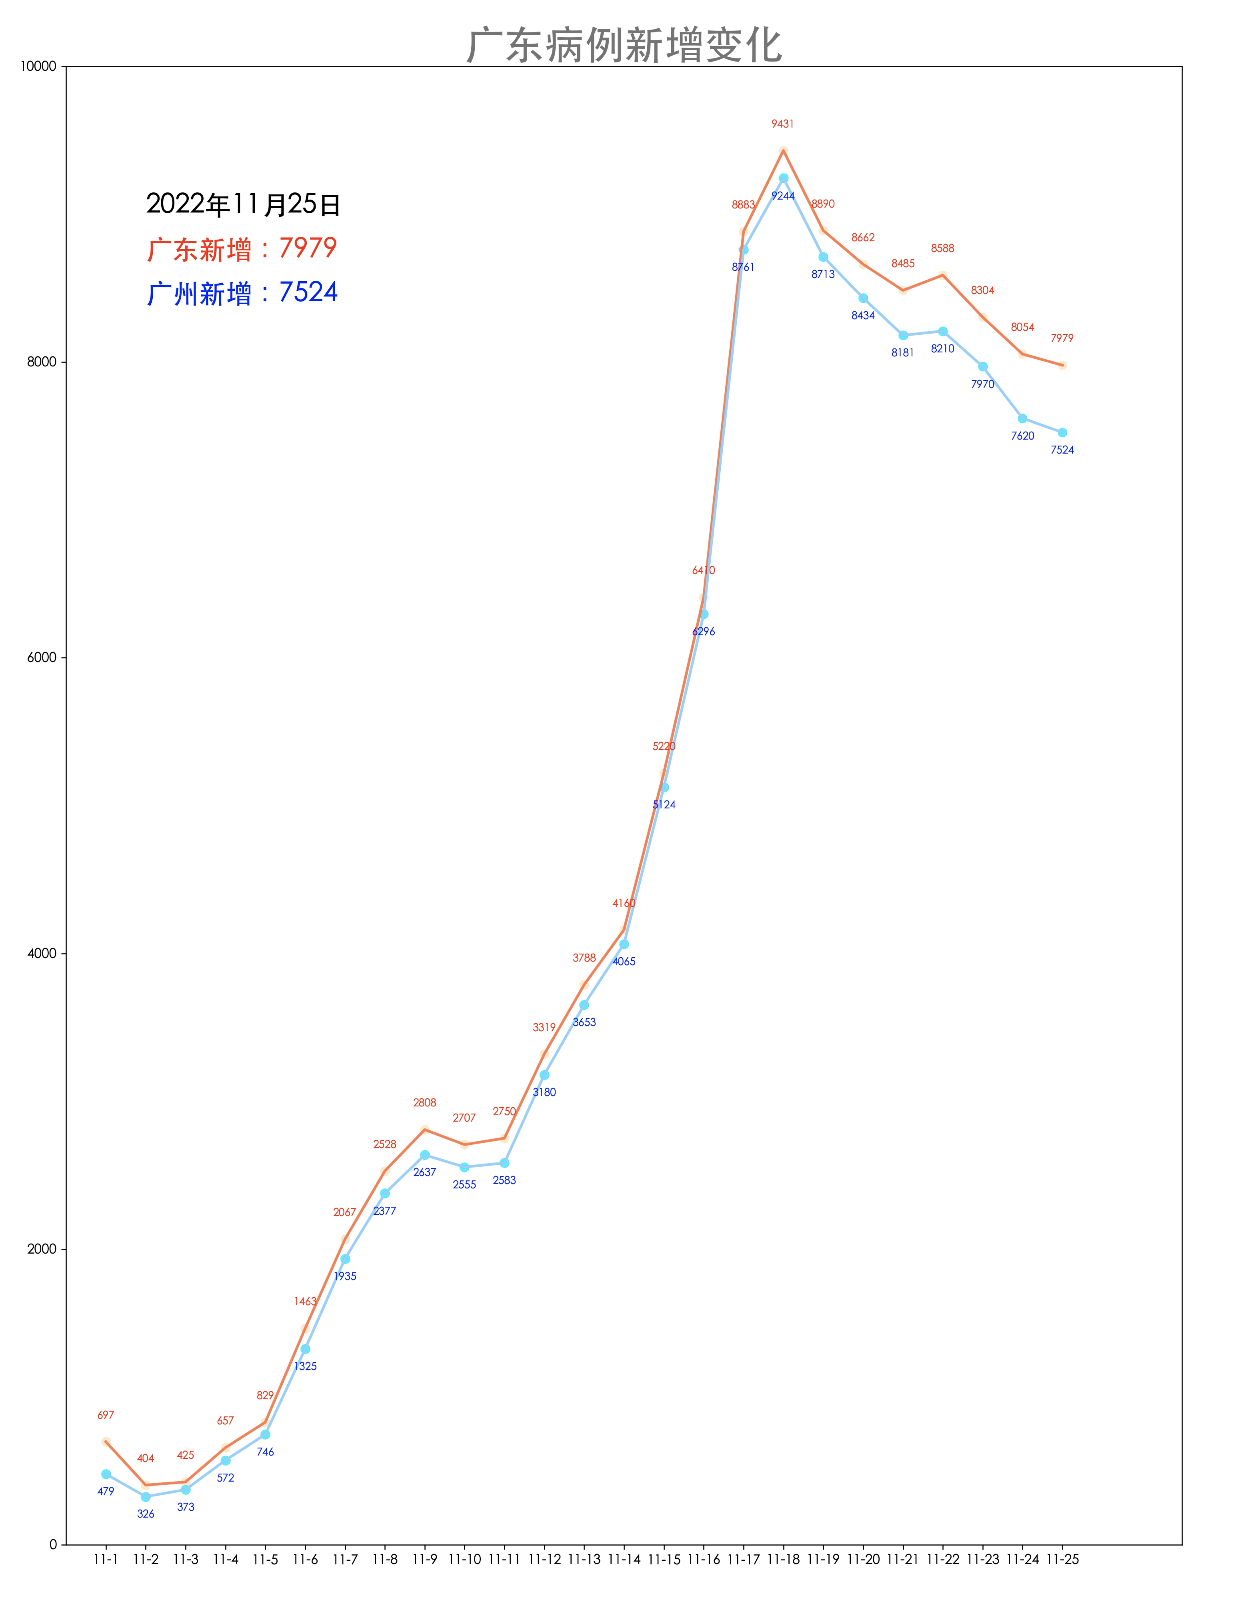
text_date.set_text(datetime_to_str(data_x[i], '2022年{}月{}日'))
plt.scatter(x, data_y1[:i + 1], color='bisque')
plt.scatter(x, data_y2[:i + 1], color='cyan')
return line1, line2, text1, text2, text_gd, text_gz, text_date
核心是的两条曲线:line1, line2,每次动态的改变它的数据,就会重画;
text1, text2是新增数,标在曲线上的;
scatter函数是标点,显眼一点;
text_gd, text_gz, text_date在左上角动态显示变化的日期和数据。
图片大体效果如下:
最后,我们要将一帧一帧整合成视频,使用以下函数:
plt.rcParams['animation.ffmpeg_path'] = '/Users/larry/Software/ffmpeg/ffmpeg'
anim.save('covid-19-Guangdong.mp4', fps=1, extra_args=['-vcodec', 'libx264'])
注意:这里需要用到软件ffmpeg,要指定你所安装的位置。这个软件可以直接从这里下载:https://evermeet.cx/ffmpeg/
最终视频效果如下:
# 6 最后
愿大家健康快乐!
代码请看GitHub: https://github.com/LarryDpk/pkslow-samples
References:
How to Animate Line Plots Using Matplotlib in Python (opens new window)
https://medium.com/intel-student-ambassadors/live-graph-simulation-using-python-matplotlib-and-pandas-30ea4e50f883
https://towardsdatascience.com/animations-with-matplotlib-d96375c5442c
Excel Date:
https://www.geeksforgeeks.org/python-convert-excel-serial-date-to-datetime/
https://www.geeksforgeeks.org/how-to-convert-a-python-datetime-datetime-to-excel-serial-date-number/
https://stackoverflow.com/questions/31359150/convert-date-from-excel-in-number-format-to-date-format-python
Example and Turorial:
Top 50 matplotlib Visualizations – The Master Plots (with full python code) (opens new window)
Matplotlib Animation Tutorial (opens new window)
Colors:
https://matplotlib.org/stable/gallery/color/named_colors.html